Several of the late payment numbers that get quoted in New Zealand are older than they look. This article sets out the current figures, what each one measures, which well known numbers date from 2019 to 2023, and how to compare your own business with them.
The current numbers
Xero publishes two payment measures for New Zealand every quarter. Both come from invoices raised in Xero by small businesses, which Xero defines as businesses with annual sales under $33 million. Xero says the programme draws on about 144,000 New Zealand small businesses. It doesn't say how many sit behind the payment figures.
| Measure | July to September 2026 | What it counts |
|---|---|---|
| Time to be paid | 25.4 days | Days from the invoice date to the day the invoice was fully paid |
| Late payments | 5.2 days | Days from the due date to the day the invoice was fully paid |
| Implied average terms | About 20 days | Our subtraction: 25.4 less 5.2 is 20.2 |
Three details in Xero's methodology change how you should read them.
The averages are weighted by invoice value. Xero also reweights businesses so the industry mix matches the country's, and removes seasonal patterns from each measure. Your own figure will be raw. A $20,000 invoice counts for twenty times as much as a $1,000 invoice from the same business, so the figure describes where the money is, not the typical invoice.
Only invoices that were fully paid are counted. An invoice that is still unpaid, or was paid more than a year after it was issued, is left out. A bad debt never shows up.
In the late payment measure, an invoice paid early counts as a negative number. So 5.2 days is early and late payers netted off against each other.
The third row of the table is ours, not Xero's. If the average invoice is paid 25.4 days after it's issued and 5.2 days after it's due, the average due date sits about 20 days after the invoice date. It assumes both averages cover the same invoices, so treat it as a rough guide. It does line up with the one other figure we found: MYOB customer data for 2021, reported by MBIE, put the average terms of larger small businesses at 20.7 to 21.2 days.
One average, very different waits
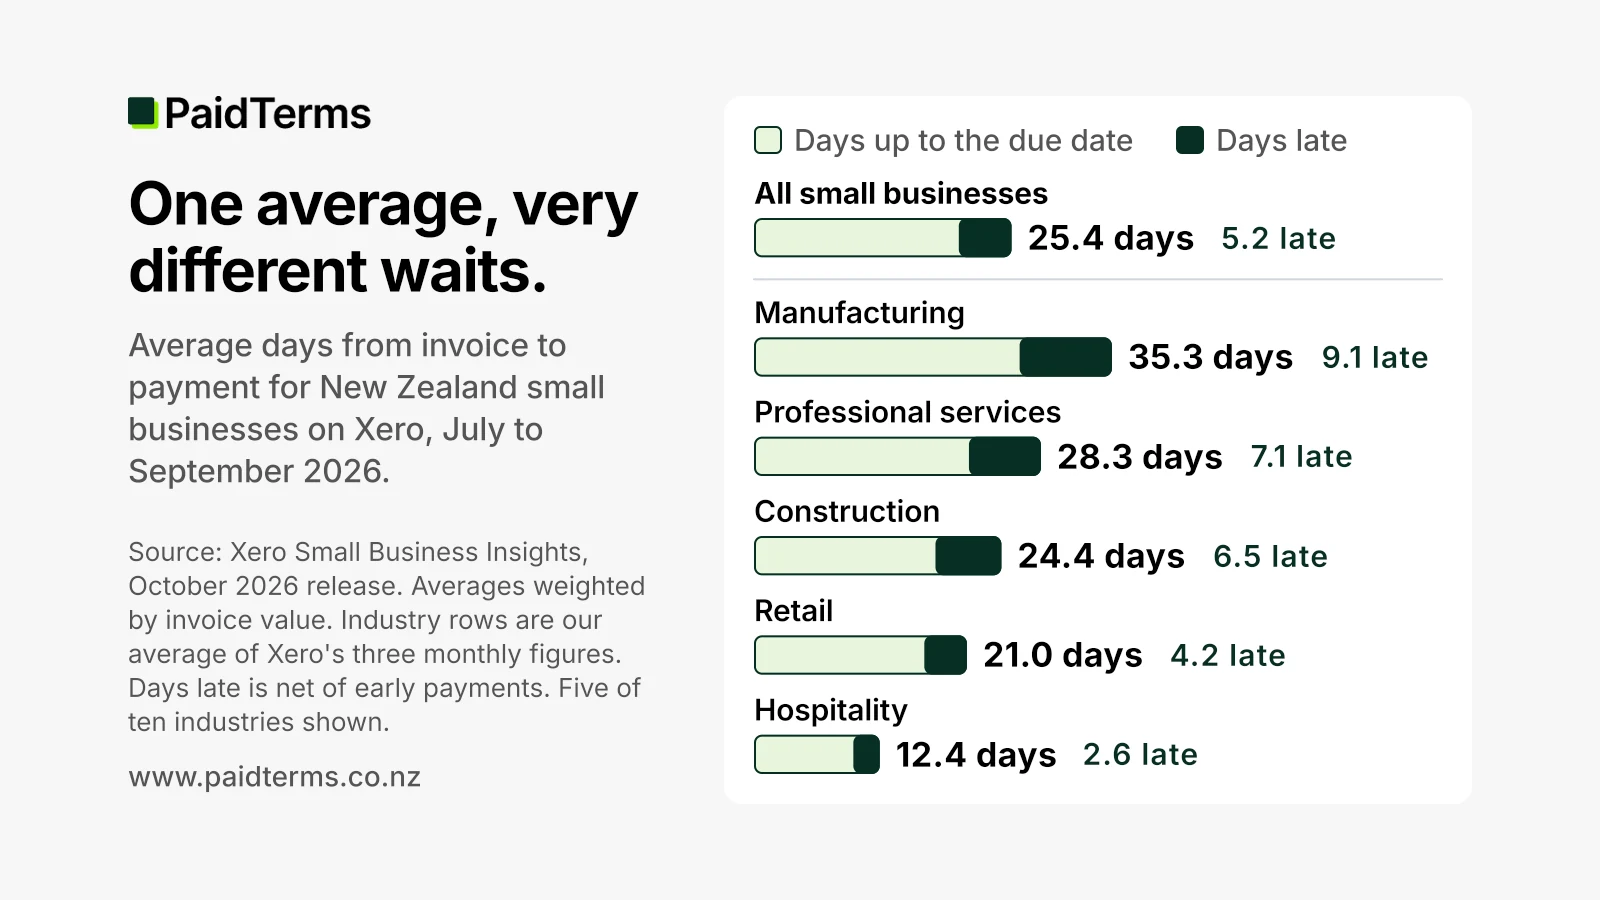
The national figure blends industries that are paid in very different ways. Xero's data file gives a monthly figure for ten industries. We averaged the three months of the September 2026 quarter for each one. Doing the same to the national monthly figures gives exactly the 25.4 and 5.2 that Xero published, so the method matches.
| Industry | Days to be paid | Days late |
|---|---|---|
| Manufacturing | 35.3 | 9.1 |
| Health care and social assistance | 28.9 | 10.2 |
| Professional, scientific and technical services | 28.3 | 7.1 |
| All small businesses | 25.4 | 5.2 |
| Construction | 24.4 | 6.5 |
| Agriculture, forestry and fishing | 23.4 | 2.6 |
| Administrative and support services | 22.4 | 3.7 |
| Other services | 21.8 | 3.8 |
| Retail trade | 21.0 | 4.2 |
| Rental, hiring and real estate services | 18.1 | 6.9 |
| Accommodation and food services | 12.4 | 2.6 |
A small manufacturer waited nearly three times as long as a business in accommodation and food. The data doesn't say why. Our reading is that it has more to do with how each industry sells than with how its customers behave. A manufacturer sells on account to other businesses, while a cafe or motel takes much of its money at the counter.
Some cautions. Xero says the industry samples are smaller than the national one and more likely to move around. The business picks its own industry in Xero, and Xero doesn't check it. Health care swung from 7.7 days late in July to 13.5 in August, so don't lean on a single quarter there. And there is no wholesale trade series in the file, so a wholesaler has no direct benchmark here and is better off comparing its wait with its own terms.
Has it been getting worse?
Not on this measure. We took Xero's monthly figures back to January 2017 and averaged each calendar year.
| Year | Average days to be paid | Average days late |
|---|---|---|
| 2017 | 26.2 | 7.4 |
| 2018 | 26.1 | 7.4 |
| 2019 | 26.5 | 7.8 |
| 2020 | 25.7 | 7.5 |
| 2021 | 23.6 | 5.9 |
| 2022 | 24.0 | 5.9 |
| 2023 | 24.9 | 6.3 |
| 2024 | 24.9 | 6.0 |
| 2025 | 24.9 | 5.3 |
| 2026, January to September | 24.9 | 4.7 |
The wait has sat between 23.6 and 26.5 days in every full year since 2017. Lateness has come down, from 7.8 days in 2019 to 5.3 days in 2025. Xero's October 2026 report also says New Zealand has the shortest late payment times of the five countries it tracks.
Two things stop this being a tidy good news story.
The September 2026 quarter went the wrong way. Late payments rose 0.9 days to 5.2, and Xero called it a sign that cash flow may be coming under pressure.
And small moves between quarters are within the range of Xero's own revisions. In July 2026 Xero reported the June quarter as 24.1 days to be paid and 4.7 days late. In the October data the same quarter reads 25.1 days and 4.3 days late. Xero revises the series every month as new data arrives, so a change of a few tenths of a day is not a trend.
Surveys can tell a different story. In a YouGov survey of 300 New Zealand business owners and decision makers for GoCardless in August 2025, 51% said they were waiting longer to be paid than a year earlier. Xero's invoice data shows the same average wait, 24.9 days, in both 2024 and 2025. Both can be right. An average can hold steady while some businesses wait longer and others wait less, and a survey records what owners feel, which matters in its own way.
The famous numbers, and how old they are
These are the figures that turn up in articles, pitches and social posts about late payment in New Zealand. We've used several of them ourselves.
| The number | What it measured | Data from | Published by |
|---|---|---|---|
| 45% of invoices are paid late | Share of invoice value paid after the due date, small businesses on Xero | 2021 | Xero and Accenture, September 2022 |
| 8% are paid more than a month late | Part of the same 45% | 2021 | Xero and Accenture, September 2022 |
| Paid 6.3 days late on average | Xero's late payment measure as at February 2022 | Early 2022 | Xero and Accenture, September 2022 |
| Late payments cost $456 million a year | An estimate of the cost of waiting, at business borrowing rates | 2021 | Xero and Accenture, September 2022 |
| Late payments cost $827 million | Xero's later estimate of the same cost | 2023 | Xero, October 2024 |
| Half of small businesses are owed $7,000 or more on any given day | Xero's own small business customers | 2019 | Xero, as reported by RNZ in September 2019 |
| 51% are waiting longer than a year ago | Opinion survey of 300 business owners and decision makers | August 2025 | GoCardless, September 2025 |
The 45% figure. It comes from a report Accenture prepared for Xero, and it describes 2021. The chart behind it is weighted by value, so it's nearer to 45% of invoiced dollars than 45% of invoices. The same chart says the figure was down from 48% in 2018. And of the 45 points, 37 were paid within 30 days of the due date, 6 were 31 to 90 days late and 2 were more than 90 days late. The 8% that gets quoted is the last two added together. We could not find a newer share from Xero, so there is no current version of this number to quote.
The 6.3 days. The report labels it as Xero's figure as at February 2022. The comparable figure now is 5.2 days. Xero changed how it calculates its measures in July 2025 and revised the history, and on today's data the average for 2021 works out at 5.9 days. That's why an old report and the current data don't match exactly.
The dollar costs. The 2022 report explains the $456 million as the cost of money for the days small and medium businesses were kept waiting. It is not money that was never paid. When Xero put the figure at $827 million for 2023, its release did not explain the method, but it did say late payment times were broadly unchanged between 2021 and 2023. Our reading is that the 81% rise mostly reflects what money cost in 2023, not slower payers. We could not find a newer estimate.
The $7,000 figure. It dates from 2019 and describes Xero's own small business customers, not every business in the country. It is seven years old. We read it in RNZ's report and in an MBIE paper, not in Xero's original release, which is no longer online where we looked.
Two we could not trace. We have repeated a claim that 67% of manufacturers and 59% of construction businesses regularly deal with late payments. We could not find a source for either figure, including in the full text of the 2022 report. The nearest real numbers are in days, not percentages. Xero's February 2026 report said small manufacturers were paid an average of 9.1 days late in the December 2025 quarter and construction businesses 7.3 days late.
What the data cannot tell you
Software users may not be typical. MBIE made this point in a 2021 regulatory impact statement. Businesses that pay for accounting software may manage their money better than those that don't, so the figures may flatter the wider picture. The same paper reported MYOB customer data showing an average payment time of 27.7 days in 2021, against Xero's 23.6 for the same year. Different customers, different number.
There is no official series that we could find. In that 2021 paper MBIE wrote that it did not know the scale or prevalence of late payment. We could not find a government series that tracks how long businesses wait to be paid.
Days late depends on the due date typed on the invoice. An invoice marked due in 7 days and paid on day 20 counts as 13 days late. An invoice on 60 day terms paid on day 60 counts as on time. The first supplier had its money 40 days sooner than the second. Lateness measures punctuality against the term. The wait is what your bank balance feels.
How to benchmark your own business
You can build the same two numbers from your own records. Take every invoice that was paid in full last quarter. For each one you need the amount, the days from the invoice date to the payment date, and the days from the due date to the payment date.
Here's a small example with four invoices.
| Invoice | Amount | Days to be paid | Days late |
|---|---|---|---|
| A | $2,000 | 14 | 0 |
| B | $5,000 | 30 | 10 |
| C | $1,000 | 7 | 0 |
| D | $12,000 | 45 | 15 |
Multiply each amount by its days, add the results up, and divide by the total amount. For days to be paid that's 28,000 plus 150,000 plus 7,000 plus 540,000, which is 725,000. Divide by $20,000 and the answer is 36.25 days. Do the same for days late and you get 230,000 divided by $20,000, which is 11.5 days.
Notice what the weighting does. The plain average of 14, 30, 7 and 45 is 24 days, which looks better than the national figure. Weighted by dollars it's about 36, because the biggest invoice was the slowest. If your large customers are your slow customers, a plain average will hide it.
Then read your two numbers, and the gap between them (36.25 less 11.5 is 24.75 days, your average terms), against your industry row above.
- Your wait is long but your days late are low. Your customers are paying roughly when you asked them to. The terms are the issue, not the customers. Shorter terms on new work, or invoicing sooner, will do more than chasing. On calendar terms the invoice date alone can add weeks, as our piece on the 20th of the month following shows.
- Your days late are well above your industry's. That points to collection. See how to reduce debtor days without damaging customer relationships and what to do when a customer pays an invoice late.
- One or two invoices drive the result. Open your aged receivables report and look at those customers by name before you change anything for everyone else.
This isn't the same sum as debtor days. Debtor days divides what you're owed today by your credit sales, so it includes invoices nobody has paid yet. The Xero style figure ignores them. Run both, because a rising pile of unpaid invoices shows up in debtor days first. The accounts receivable guide covers the rest.
If you're the one paying
The same statistics describe you from the other side. That 5.2 is what's left once early payers are netted off against customers who pay after the date on the invoice.
Run the sum on your own bills. For the supplier invoices you paid last quarter, work out the days from due date to payment, weighted by amount. If your figure is well above your suppliers' industry row, you're a slower payer than their average customer, and they can see it in their own ledger.
Paying on the due date is paying on time. These figures don't ask anyone to pay early. Our guide to how many days to take to pay suppliers goes through it.
If a supplier's terms don't fit your cash cycle, ask for different terms before the invoice falls due. Taking the extra days without asking can put an account on stop. A record of paying on time is the best argument you have, and now you can put a number on it. See how to negotiate payment terms with suppliers and what creditor days are.
It's also worth knowing your supplier's position. A manufacturer waiting 35 days on average has less room to carry a late account than a business that's paid in 12.
Where PaidTerms fits
Some invoices are too large for ordinary terms to suit either side. For those, a supplier can offer instalments through PaidTerms. The supplier is paid up front and the customer pays in 3, 6 or 9 monthly instalments. There is a fee on each side, so it suits the occasional large invoice, not everyday monthly trade.
Frequently Asked Questions
What is the average time to get paid in New Zealand?
For small businesses that use Xero, the average was 25.4 days from invoice to payment in the three months to September 2026, weighted by invoice value. The yearly average has stayed between 23.6 and 26.5 days since 2017.
What percentage of invoices are paid late in New Zealand?
The figure in circulation is 45%, and it describes 2021. It came from a report Accenture prepared for Xero, it is weighted by invoice value, and the same report said it was down from 48% in 2018. We could not find a newer share. The measure Xero publishes each quarter is days late, which was 5.2 days in the September 2026 quarter.
Is late payment getting worse in New Zealand?
Not on Xero's measure over the long run. Small businesses were paid an average of 7.8 days late in 2019 and 5.3 days late in 2025. The September 2026 quarter rose to 5.2 days from 4.3 the quarter before, which is worth watching, but recent quarters get revised as more data arrives.
Which New Zealand industries wait longest to be paid?
In the September 2026 quarter, small manufacturers waited longest at an average of 35.3 days, followed by health care at 28.9 and professional services at 28.3. Accommodation and food services waited 12.4 days. These are our averages of the monthly industry figures Xero publishes.
How much do late payments cost New Zealand small businesses?
Xero's latest estimate is $827 million for 2023, up from $456 million for 2021. The 2021 figure was an estimate of what the waiting costs at business interest rates, not a total of unpaid invoices. Xero's release did not set out the method for 2023, and we could not find a newer one.
Is 25 days a good target for my business?
Only if your terms are close to the average, which works out at about 20 days. A business on 7 day terms that waits 25 days has a collection problem. A business on 30 day terms that waits 32 is doing well. Compare your wait with your own terms first and your industry second.
News, insights and developments shaping New Zealand’s wholesale industry.
Sources
- Xero Small Business Insights, New Zealand Update, July to September 2026, published 29 October 2026, and the latest New Zealand page with its data file. Yearly, industry and revised quarterly figures in this article are our calculations from that file.
- Xero Small Business Insights, Methodology.
- Xero Small Business Insights, New Zealand Updates published 30 July 2026 and 26 February 2026.
- Xero and Accenture, Crunch: Cash flow challenges facing small businesses, Part II, September 2022. Data for 2021.
- Xero, Late payments cost Kiwi small business more than $800 million, 3 October 2024.
- RNZ, Small businesses struggling with overdue payments, 11 September 2019.
- GoCardless, Pursuing Payments 2025, 10 September 2025. YouGov survey, August 2025.
- MBIE, Regulatory Impact Statement: Better Business to Business Payment Practices, 2 December 2021.

Offer instalments
Offer your customers 3, 6 or 9 month plans, while getting paid up front.
Pay with instalments
Spread any NZ supplier invoice over 3, 6 or 9 months, while your supplier is paid up front.